
On this page
Most universities today have more analytics than they had five years ago. Enrollment dashboards. Retention reports. Assessment scorecards. Financial summaries. Institutional Research offices that produce genuinely good work, on schedule, every term.
And most Provosts, CIOs, and institutional effectiveness leaders will still tell you the same thing privately: they can describe what happened last term in detail, and still struggle to say, with confidence, what's changing right now and where they should intervene.
That gap is the real story behind academic analytics in higher education. It isn't a data shortage. It's the distance between reporting what already happened and building the kind of institutional intelligence that tells you what to do next.
Quick answer
Academic analytics only becomes useful for planning when it moves past describing the past. A dashboard that reports last term's enrollment or retention is a record. Institutional intelligence connects that record to academic performance, student outcomes, and quality signals happening right now, so leadership can see where to act, not just what already occurred.
Article summary
Problem: Institutions have more dashboards than ever, and leadership still struggles to connect what's happening across enrollment, academic performance, and outcomes.
For: Provosts, Institutional Research and Effectiveness leaders, academic leadership, and CIOs.
Shift: From analytics as a reporting function to analytics as a connected intelligence layer. Outcome: Leadership decisions grounded in what's changing across the institution right now, not a reconstruction of what already happened.
Key takeaways
Most academic analytics today describe the past accurately. Few connect it to what leadership needs to decide next. A dashboard and an institutional model are not the same thing. One report. The other reasons. The real planning question isn't "what happened this term." It's "what's changing, why, and where." Connected data across enrollment, academic performance, and quality turns analytics from a report into a decision layer.
Reporting the Past Isn't the Same as Understanding the Present
A report tells you what happened. A dashboard, even a well-designed one, is a rear-view mirror: accurate about where the institution has been, silent about where it's heading. That distinction matters more than it sounds, because most academic analytics conversations still treat "better dashboards" as the goal, when a better dashboard is still describing history.
Most universities don't struggle to produce dashboards. Institutional Research offices are good at this. What's missing is the layer underneath the dashboards, the one where a curriculum change, a shift in section availability, or a faculty vacancy shows up as a connected signal alongside enrollment and outcomes data, rather than as an isolated fact sitting in whichever system logged it. Without that layer, leadership is left doing the connecting manually, usually under time pressure, usually after something has already gone wrong.
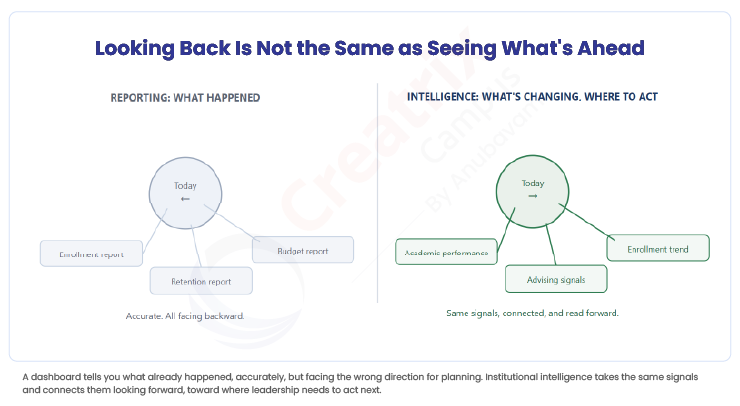
Consider what changes when analytics stops being a reporting function and starts being a planning input.
- A Provost preparing for a program review doesn't need six separate exports reconciled the night before.
- A CIO fielding a board question about student outcomes doesn't need to chase three offices for numbers that should already agree.
- An institutional effectiveness leader building next year's plan doesn't need to guess which of last term's anomalies were noise and which were early signals, because the connection between academic performance, enrollment, and outcomes was already visible when it mattered.
| Approach | What it produces | What it misses |
| Standalone dashboards | An accurate picture of what already happened, department by department | The connection between signals happening at the same time, in different systems |
| Manual reconciliation before decisions | A point-in-time view, usually assembled under deadline pressure | Continuity; the picture goes stale again as soon as the meeting ends |
| Connected institutional model | Academic performance, enrollment, and outcomes read against each other continuously | Nothing new to collect; it uses data institutions already generate |
From Dashboards to an Institutional Model
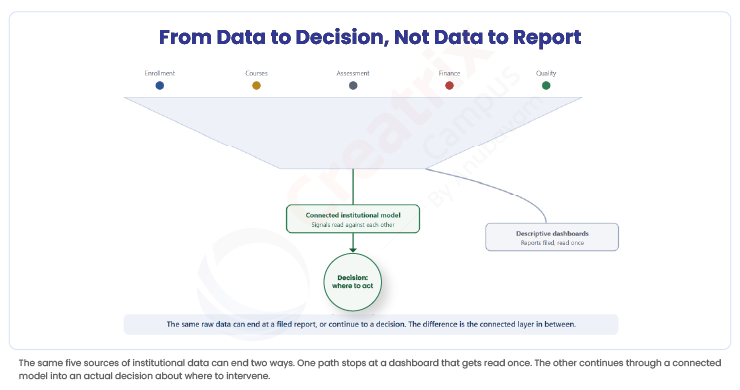
The shift that actually changes planning isn't a new analytics tool. It's a different question asked of the data that already exists: not "what did this metric show last term," but "what else was moving when this metric moved."
That question only gets answered when academic performance, enrollment, advising, and quality data share a common institutional model, one where a curriculum change or a retention dip is visible as a single connected event, not four unrelated exports waiting to be reconciled by hand.
This is where analytics functions differently inside an Academic Operating System than it does as a standalone reporting tool. It isn't an overlay that observes the institution from outside. It draws from the same governed data that runs curriculum, scheduling, assessment, and student records, so a signal appearing in one lifecycle stage is visible, in context, wherever leadership needs to see it.
That's the practical meaning of connecting academic and institutional signals into one planning view: a Provost sees the early academic-performance signal before it becomes next term's enrollment story.
None of this requires replacing the dashboards Institutional Research already builds. It requires the data underneath them to talk to each other before the next planning cycle, not after it.
If your institution's reports are individually strong but rarely get reconciled into one view before a real decision gets made, that's worth raising with your leadership team now, not during the next program review.
See how a connected academic analytics layer works for your institution.
Quick recap
Academic analytics in higher education isn't short on dashboards. It's short on connection between them. A single emerging problem, a program softening, a cohort struggling, usually shows up first as three separate, accurate observations in three separate systems, and nobody is positioned to connect them until the lagging indicator, enrollment, confirms it. The fix isn't another report. It's a shared institutional model where academic performance, enrollment, advising, and quality signals read against each other continuously, so leadership sees what's changing and where to act while there's still time to act on it.
Frequently asked questions
How is academic analytics different from a reporting dashboard?
Do universities need predictive models to get value from academic analytics?
Who should be looking at connected academic analytics, not just department-level dashboards?
Does this replace the reports Institutional Research already produces?
Join the conversation
Want to contribute?
We welcome thought leaders to share ideas and write for our blog.
Become a guest author