
On this page
A student misses classes for two weeks. No one notices until the grade is posted, and by then the student has stopped logging in. Nothing dramatic happened. Support simply arrived too late.
Universities already know that student success matters. The harder question is how to see barriers early, intervene effectively, check whether the intervention worked, and make sure the right people are accountable. This guide covers what student success means, what stops students succeeding, how to measure it, seven strategies backed by research, and where AI helps and where it does not. Most of the research cited is from the US, and we say so each time.
Quick answer
Student success in higher education is students’ achievement, growth and wellbeing during their studies, shown in persistence, progression, completion and what they do afterwards. Institutions improve it by making pathways clear, advising proactively, spotting difficulties early, coordinating academic, financial and wellbeing support, and checking that each intervention actually resolved the barrier.
Article summary
This guide defines student success and its measures, summarises current research on what holds students back, sets out seven strategies, explains responsible use of AI and predictive analytics, and offers a readiness checklist.
Key takeaways
- Persistence, retention, progression and completion are different measures. Treating them as one hides how students actually move.
- Student success is not only an academic ability question. Stress, mental health, cost, belonging and administrative barriers all play a part.
- Leading indicators, such as first-term credit completion, reveal problems while there is still time to help.
- The most important step is closing the loop: tracking whether an intervention resolved the barrier and improved progress.
- AI can support the work, but a risk score alone neither explains why a student is struggling nor decides the right intervention.
What Is Student Success in Higher Education?
Student success is students’ achievement, growth and wellbeing during their time at a college or university: academic performance, personal development, professional preparedness and a sense of belonging. It benefits students first, and institutions follow, through satisfaction, retention, reputation and a skilled graduate workforce.
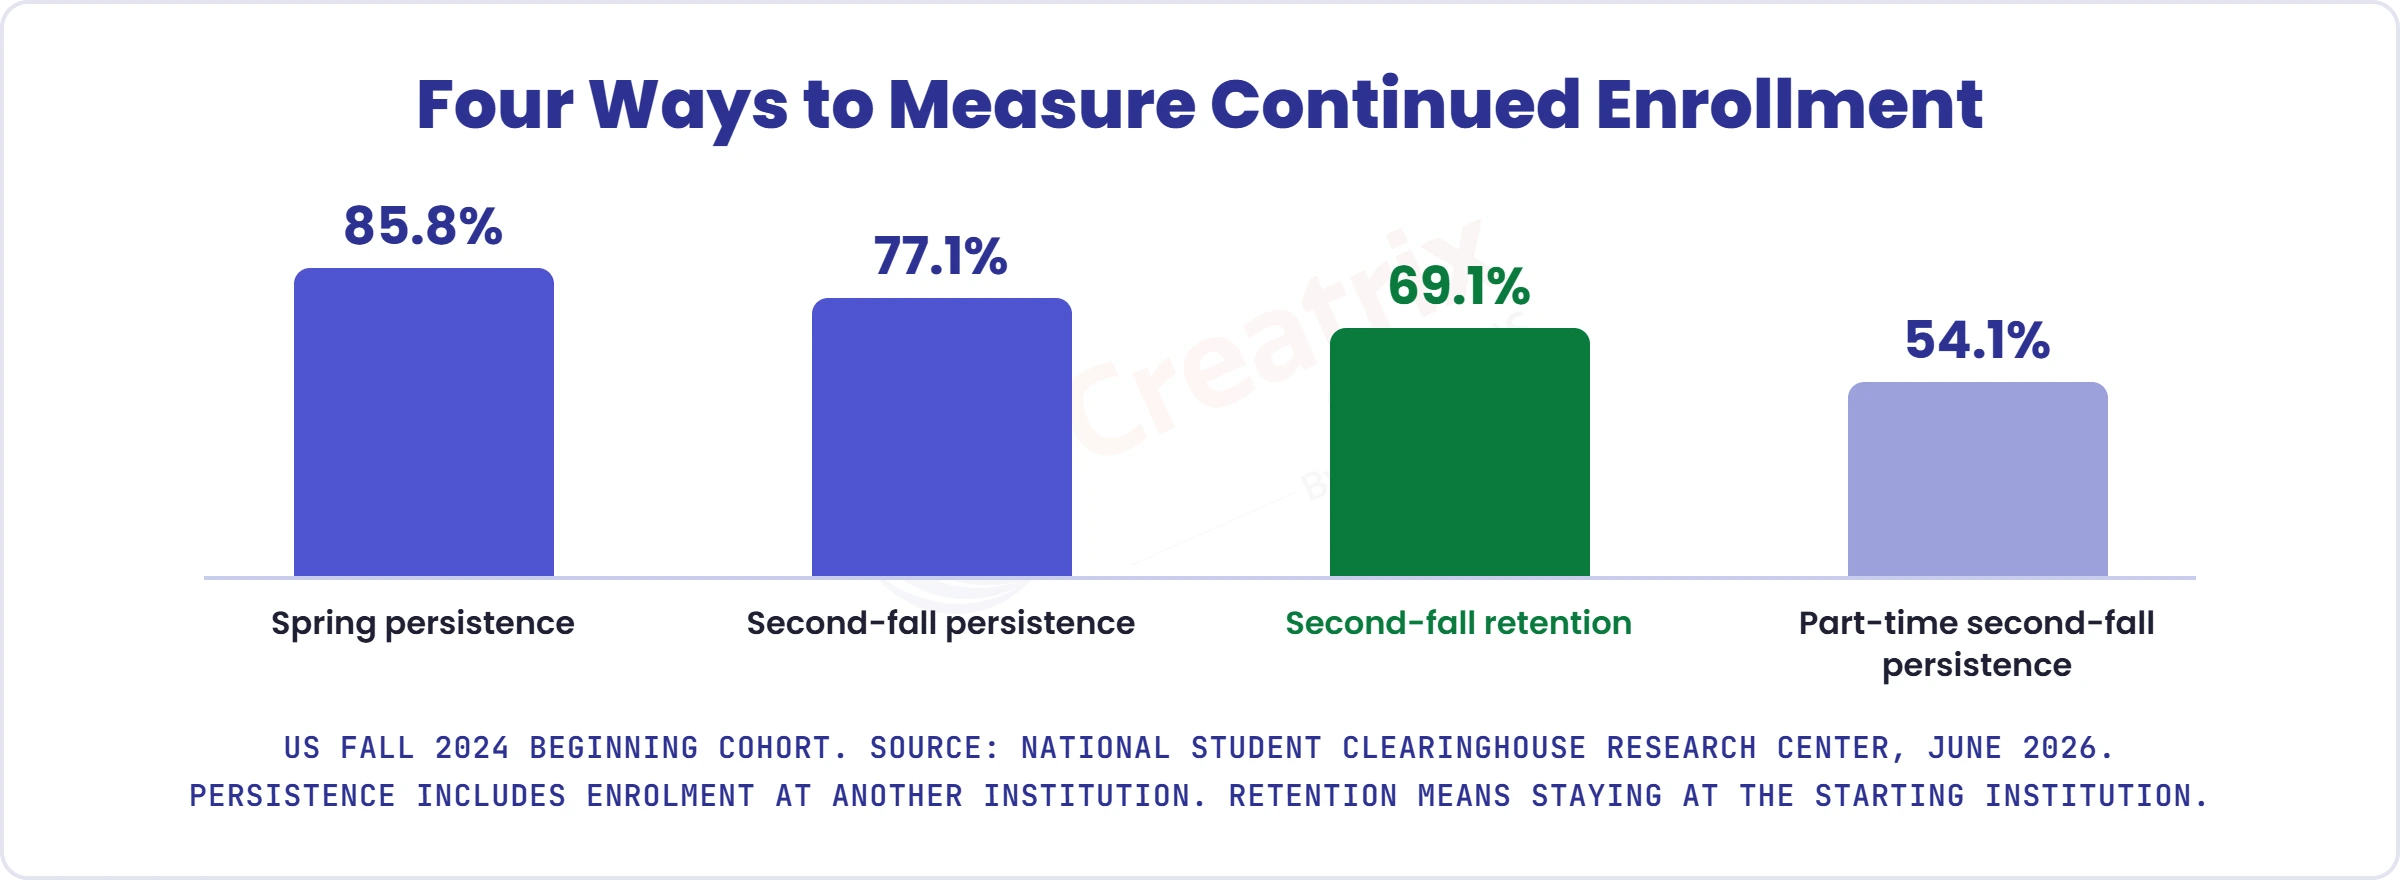
Four terms are often confused. Persistence means a student continues in higher education, including at another institution. Retention means a student stays at the institution where they started. Progression is movement through the programme, and completion is earning the credential. A student who transfers to a better-suited institution has persisted without being retained.
The difference shows in the data. The US National Student Clearinghouse Research Center’s June 2026 report followed nearly 2.62 million students who began in fall 2024. 85.8 percent persisted into spring 2025 and 77.1 percent into fall 2025, but 69.1 percent were retained at their original institution after one year. Second-fall persistence among part-time starters was 54.1 percent.
What Prevents Students From Succeeding?
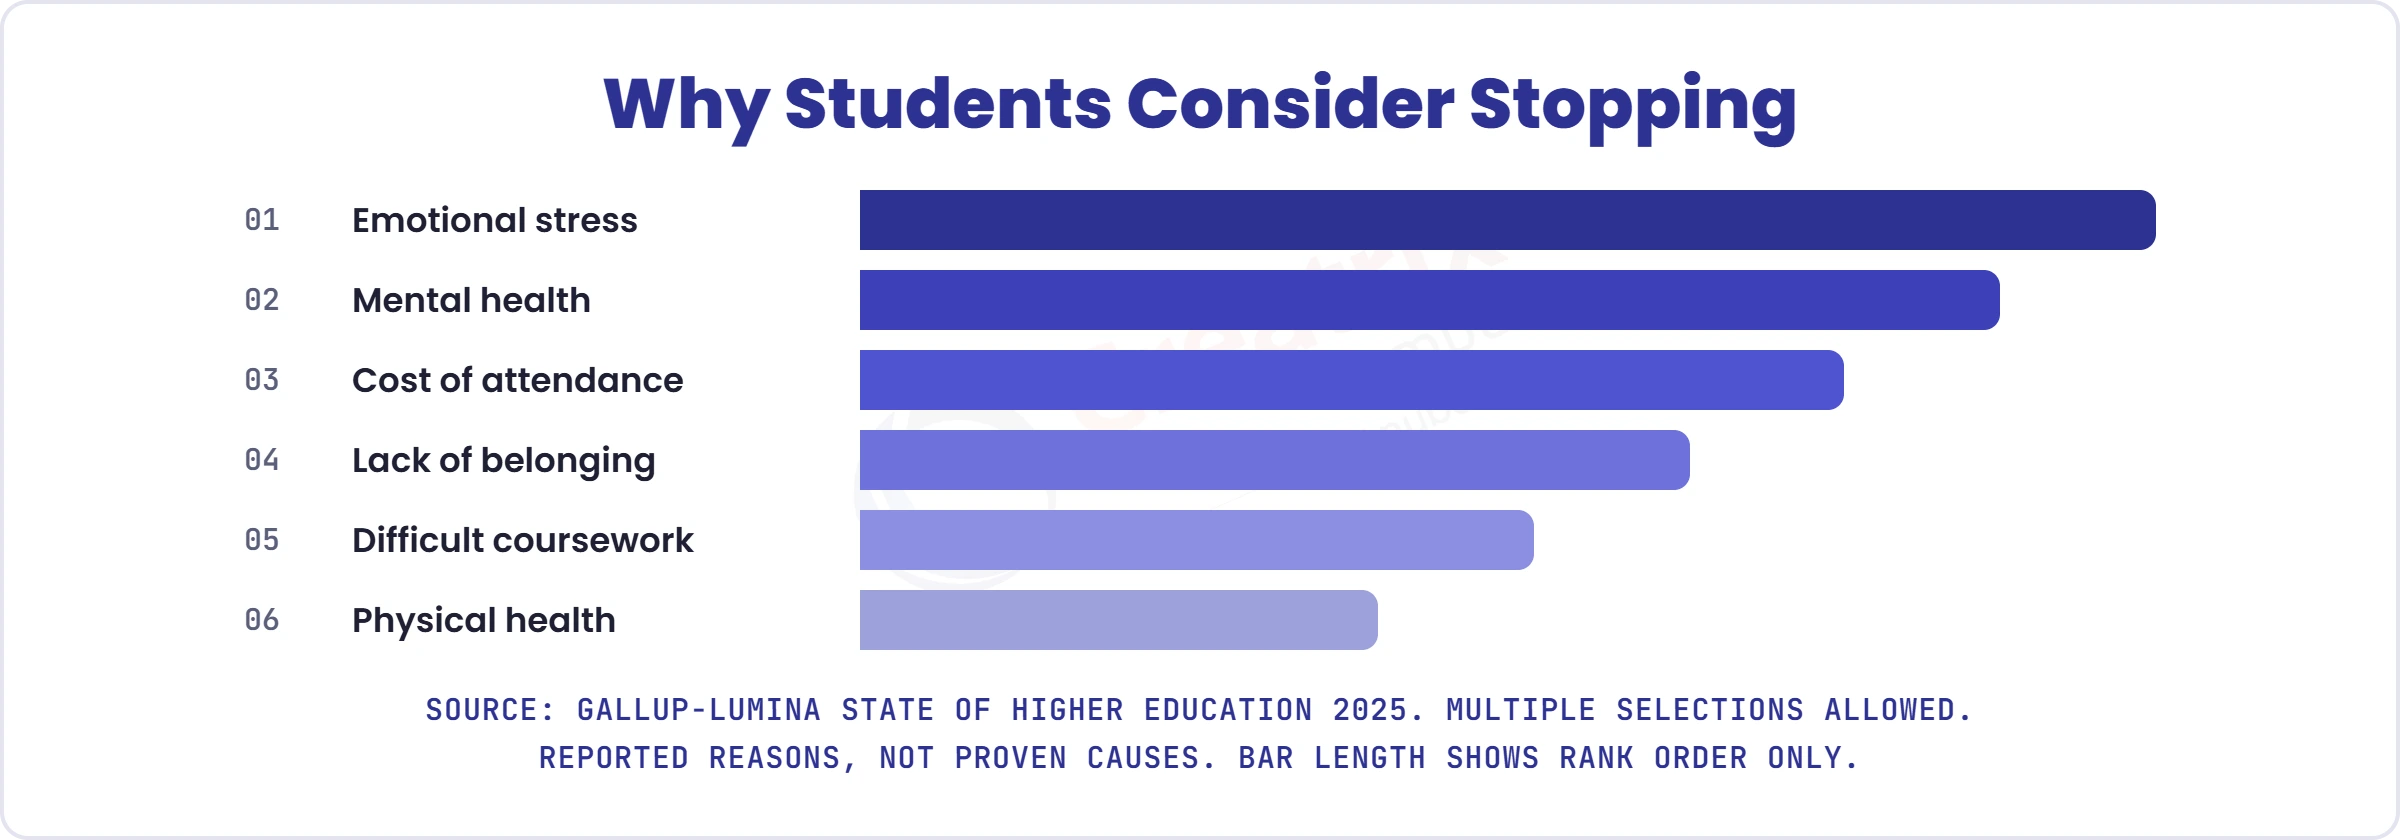
Gallup and Lumina’s 2025 State of Higher Education report asked enrolled students who had considered stopping their coursework why. Emotional stress and mental health were the most frequently cited reasons, followed by cost of attendance, lack of belonging, difficult coursework and physical health. Students could choose more than one, and these are reported reasons, not proven causes. The older 2023 Inside Higher Ed and College Pulse Student Voice survey of 3,004 US students named ineffective teaching styles, difficult material, balancing work, unclear expectations and mental health, and found that only 55 percent had been guided on required courses and sequences through advising.
Barriers fall into six groups.
| Barrier | Examples | Institutional response |
| Academic | Gateway-course failure, unclear requirements, poor feedback | Tutoring, curriculum review, targeted support |
| Financial | Fees, financial holds, housing and food insecurity | Financial assistance, emergency support, coordinated referrals |
| Administrative | Delayed registration, unavailable courses, credit-transfer issues | Degree planning, workflow fixes, clearer policies |
| Personal and social | Stress, mental health, isolation, lack of belonging | Accessible human support, inclusive learning environments |
| Engagement | Weak academic connection, low participation, thin advising | Proactive advising, faculty interaction, meaningful outreach |
| Career relevance | Unclear pathways, perceived low programme value | Career advising, internships, skills development |
The Hope Center’s basic-needs research adds that food and housing insecurity is widespread among US students. One caution on tone: the 2024 to 2025 Healthy Minds Study found severe depression among surveyed students fell from 23 percent in 2022 to 18 percent in 2025. Support still matters, but not every wellbeing indicator is worsening.
How Do Universities Measure Student Success?
Retention and graduation rates arrive too late to help the student in front of you. Complete College America’s Momentum approach focuses on obstacles early in the journey: course sequencing, gateway courses, credit accumulation and unclear degree pathways. Institutions therefore track three kinds of measure.
| Type | Examples | Why it matters |
| Leading indicators | First-term credit completion, gateway-course success, registration continuity, unresolved holds | Reveal emerging obstacles |
| Operational measures | Advisor response time, intervention follow-through, referral completion, support use | Show whether support is working |
| Outcome indicators | Persistence, retention, completion, time to degree, post-graduation outcomes | Show longer-term progress |
Illustrative KPI definitions:
| KPI | Calculation | Suggested owner |
| First-term credit completion | Credits completed ÷ credits attempted × 100 | Academic Affairs |
| Gateway-course success | Students passing the gateway course ÷ students enrolled × 100 | Academic Affairs |
| Registration continuity | Students registered for the next term by the deadline ÷ eligible students × 100 | Registrar |
| Intervention follow-through | Flagged students contacted within the agreed time ÷ students flagged × 100 | Advising |
Each institution must still define cohorts, exclusions, reporting periods and data quality before using them.
Seven Strategies to Improve Student Success
- Make academic pathways easy to navigate. Students need clear requirements, prerequisite sequences, available courses and an expected graduation path. Track credit accumulation, course completion and time to degree.
- Move from reactive to proactive advising. Do not wait for students to ask. Use registration gaps, academic concerns and missed milestones to prompt outreach. Complete College America reports a 1.9-point retention improvement at the University of Cincinnati, but as a reported institutional outcome, not a universal effect of advising software.
- Identify difficulties before they compound. Combine assessment results, credit progress, gateway-course outcomes and faculty observations. A low score should prompt support, not label a student as likely to leave.
- Coordinate academic, financial and wellbeing support. Set clear referral routes between advising, student services, financial aid and specialist teams, with access limited to those who need it.
- Remove preventable administrative barriers. Review course availability, timetable clashes, registration holds and prerequisite errors. An institution can have excellent advising and still lose students because the courses they need are full.
- Connect progress to future opportunity. Offer credible career information, experiential learning and competency evidence, and measure outcomes in context, including students who continue to further study.
- Close the loop between intervention and outcome. Record whether a student received support, whether the barrier was resolved and whether progress improved. Compare against suitable groups instead of counting alerts or emails sent.
The seventh point matters most. Collecting more data does not improve student success. Turning evidence into timely, accountable action, and testing the result, does.
How Can AI and Predictive Analytics Support Student Success?
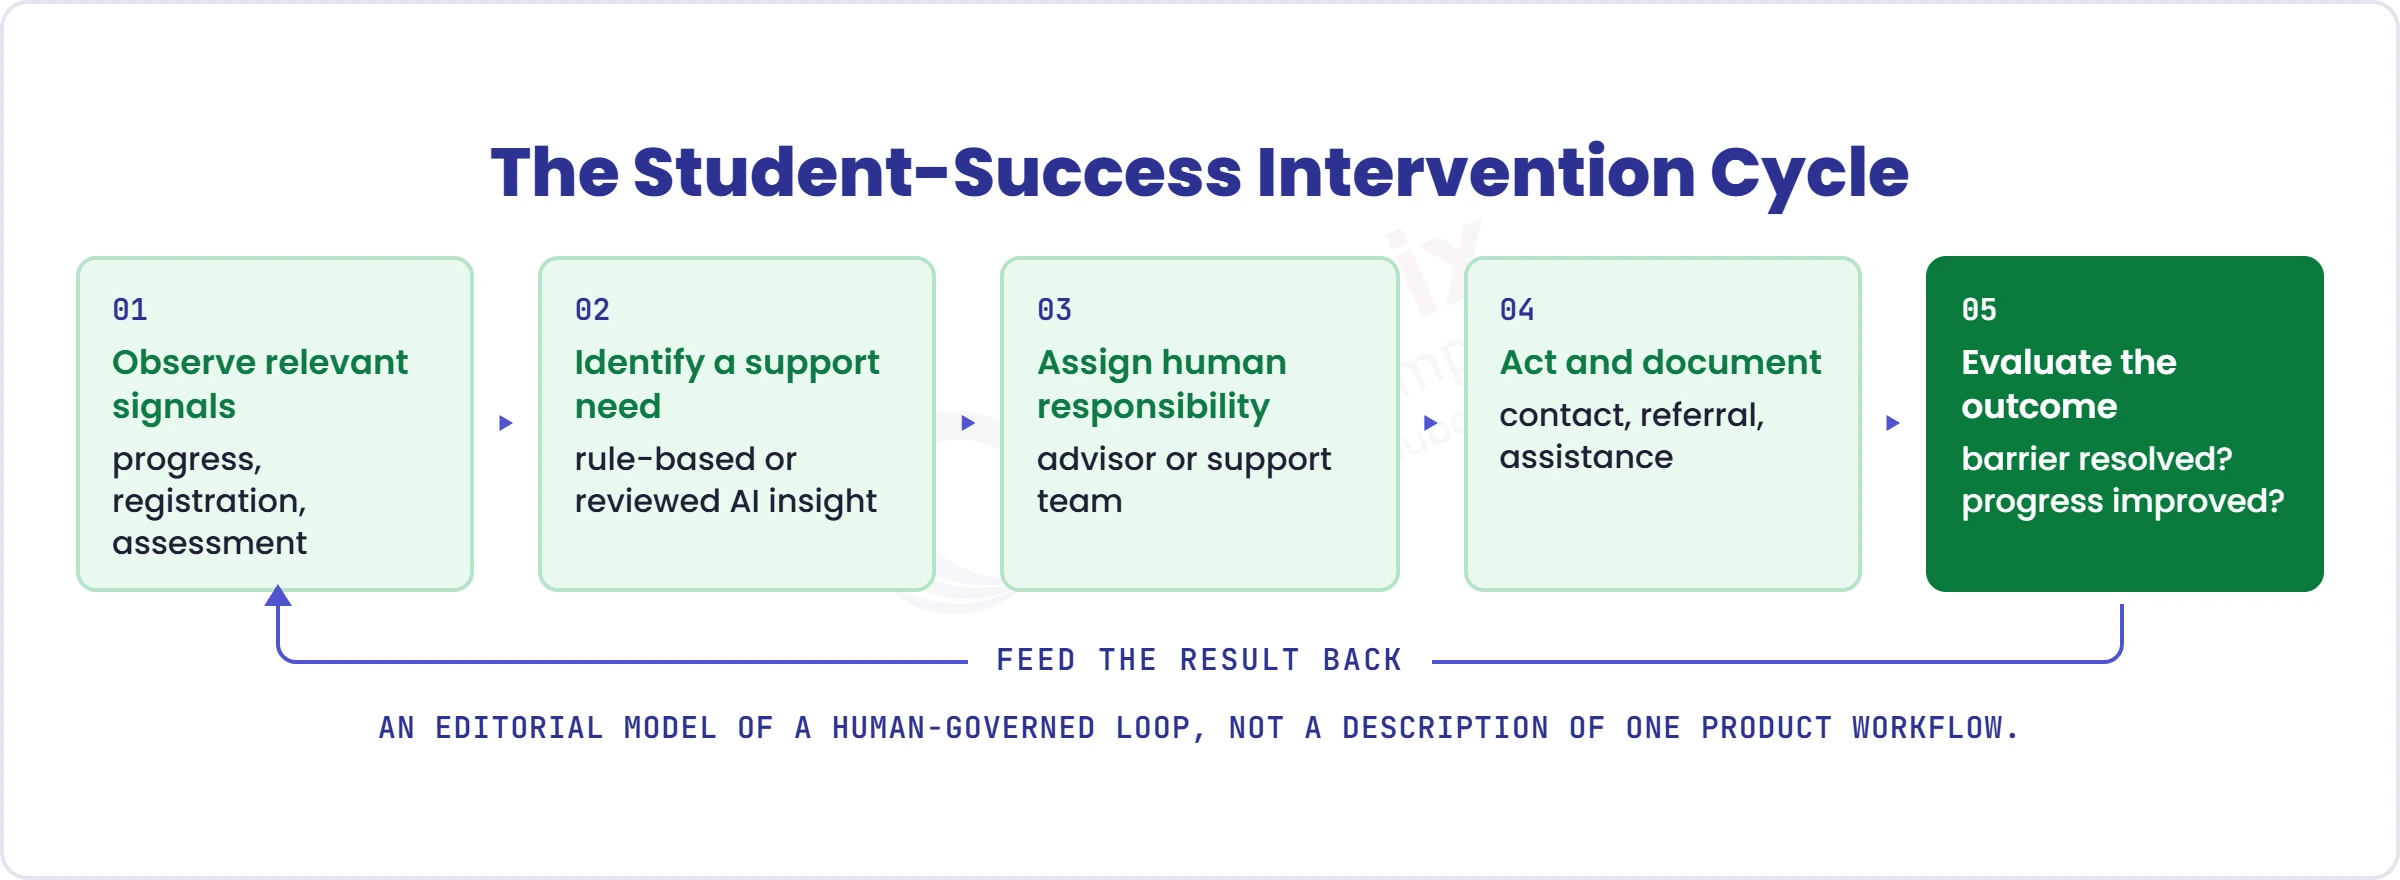
EDUCAUSE’s 2025 Data and Analytics Horizon Report names data governance, analytics and AI as important capabilities for student success, and its AI ethical guidelines raise fairness, autonomy, explainability and responsibility in AI-assisted advising. A workable model is a human-governed loop: observe signals, identify a support need through rules or reviewed AI insight, assign a person, act and document, then evaluate the outcome.
Five practical uses fit that loop: degree-progress monitoring, course-demand forecasting, proactive advising, spotting registration bottlenecks, and coordinating support services. Controls matter as much as models: human oversight, data minimisation, transparency, bias testing, restricted access, and a route for students to challenge a wrong inference.
Two cautions. A risk score shows a correlation, not why a student is struggling or what to do about it. And technology can add barriers: EDUCAUSE’s March 2026 Students and Technology report found 46 percent of surveyed students had met a security threat in the previous year. A chatbot answering common questions is not a support system that finds a barrier, routes it to an advisor, documents the action and checks the result.
Why Do Fragmented Systems Make Student Success Harder?
A student’s progress depends on decisions across curriculum planning, registration, teaching, assessment, advising, finance and records. When those sit in separate tools, no one sees the whole picture, and student success becomes a dashboard instead of a practice.
- Students cannot enrol in required courses: curriculum and academic operations are not coordinated.
- Difficulties are found late: assessment, progression and advising data are not visible together.
- Advisors lack context: access to relevant records is not governed or complete.
- Support is inconsistent: ownership and workflows are unclear.
- Leaders cannot judge interventions: there is no traceable evidence.
Readiness checklist. Answer yes or no.
- We have agreed definitions of persistence, retention and completion.
- We can identify students facing registration or progression barriers before the next term.
- Each intervention has an accountable team.
- Advisors have appropriate access to relevant academic information.
- We can show whether interventions resolved the reported barrier.
- We review support outcomes, including gaps between student groups.
- Our AI and analytics processes have documented privacy, fairness and oversight controls.
- Outcomes feed back into academic and operational processes.
Several no answers suggest an operating-model review is worth doing. This is a planning aid, not a validated maturity assessment.
How Creatrix Campus Supports Connected Student Success
In Creatrix Campus, advising and student success sit in Student Success & Records: advisor assignment, advising appointments and notes, early alerts and interventions, success plans, retention analytics, and wellbeing referral tracking (referral and status only, since clinical counselling records are not held there). Attendance captured in Academic Operations feeds early alerts, and the Degree Audit Engine and What-If Analysis show students their progress and options.
Registration holds and financial holds are managed in the same journey, Assessment & Outcomes makes expectations and assessment criteria clear, and Quality Assurance & Accreditation can reuse the resulting evidence. Where AI supports advising, every suggestion carries a human approval step.
Conclusion
Student success is not one department’s job. It is the result of connected decisions, made early, owned by someone, and checked afterwards. Institutions that define their measures clearly, act on leading indicators and close the loop keep more of the students they work hard to enrol.
If you want to see how advising, holds, attendance and degree progress connect on one student record, talk to us about a Tailored Proof Session.
Quick recap
Measure early, coordinate across departments, keep a human accountable for every intervention, and check whether it worked.
Frequently asked questions
What is student success in higher education?
What is the difference between student success and student retention?
How do universities measure student success?
How can universities improve student success?
How can AI support student success without creating risks?
How can institutions tell whether interventions work?
Join the conversation
Want to contribute?
We welcome thought leaders to share ideas and write for our blog.
Become a guest author