
General
Institutional Analytics for Higher Education: Why Leaders Still Wait Weeks for an Answer
Most leadership questions still take weeks to answer, not because the data doesn't exist, but because it lives in five places that don't agree. Here's what real institutional decision support actually requires.
On this page
Picture a routine leadership meeting. A vice chancellor asks a simple question: how many students are actually on track to graduate this term. Nobody in the room has the number. Someone promises to "pull it together" and get back by the end of the month.
That delay isn't a staffing problem, and it isn't because the institution lacks smart people who understand its data. The number exists. It's just scattered across the registrar's system, a financial aid spreadsheet, and a course-completion export that three different offices maintain slightly differently. Getting one clean answer means someone reconciling all three by hand.
This is the gap between reporting and decision support, and it's wider at most universities than anyone likes to admit. A report tells you what happened last month. Decision support means the person asking the question can get an answer in the room, drill into it themselves, and trust that the number agrees with whatever the board sees next week.
Quick answer
Institutional analytics software for higher education connects enrollment, financial, course, and faculty data into one governed source that leadership can query directly, rather than waiting for an IR office to manually reconcile separate exports into a static report. Genuine decision support means a leader can ask a follow-up question and drill into the answer themselves, in the same conversation, instead of submitting a new data request and waiting weeks.
Article summary
The case for institutional analytics rests on a distinction leaders often miss: a static monthly report and a live, queryable decision-support system solve different problems. The real question is why that gap persists, even at institutions with capable institutional research teams, and what has to change before analytics can support decisions in real time.
Key takeaways
- A static report answers the question that was asked last month. Decision support means answering the follow-up question the leader asks next, in the same sitting.
- Most institutions don't lack smart IR analysts. They lack a single governed data layer, so every reconciliation happens by hand, every time.
- AIR, the Association for Institutional Research, has served IR and effectiveness professionals for 60 years, evidence that reconciling institutional data for leadership decisions is a mature, ongoing discipline, not a problem any one university can wish away.
- A dashboard that only displays last month's PDF in a nicer layout is not decision support. It's a report with better formatting.
- The institutions that get real value from analytics evaluate for one governed metric definition across offices, not for how many charts a vendor can render.
The Question Nobody Can Answer in the Room
Ask five people at the same institution for the current enrollment number and you may genuinely get five different figures, not because anyone is careless, but because each office defines "enrolled" slightly differently and pulls from a slightly different export, on a slightly different day.
Multiply that by every metric a provost, president, or board actually cares about: retention, course completion, faculty workload, budget-to-actual variance, and the fragmentation compounds. Institutional research offices exist precisely to referee these discrepancies, and the fact that this discipline has needed a dedicated professional community for six decades says something about how persistent the underlying problem is.
What Separates a Report From Decision Support
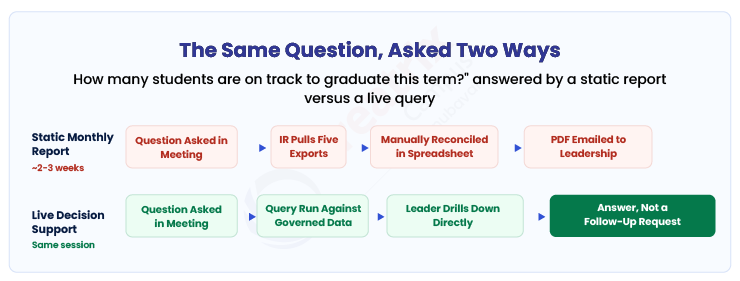
A report is something you receive. Decision support is something you interrogate. That distinction sounds abstract until you watch it play out in an actual meeting: a PDF report gets emailed around, someone asks a follow-up question about a specific department or term, and the honest answer is that nobody can drill into it without going back to IR and starting a new request.
Real decision support flips that sequence. The leader asks the question, queries the same governed data source directly or with light help, and gets to a specific answer without waiting for someone else's schedule to open up. The difference isn't the visual polish of a dashboard. It's whether the person asking the question can actually follow their own curiosity.
This matters more at accreditation and board review time than any other moment. A reviewer asking "show me retention by program for the last three years, broken out by first-generation status" is not a question a static annual report is built to answer on the spot.
Why the Data Stays Scattered Even When the Will Is There
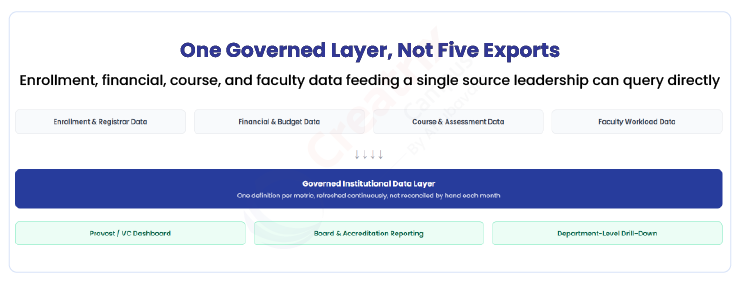
It's tempting to assume this is a leadership priority problem, that if the president simply demanded better reporting, the fragmentation would resolve itself. In practice, most institutions already want this. The obstacle is structural: enrollment data lives in the student information system, financial data lives in the ERP or a separate finance tool, course and assessment data lives with the LMS or curriculum system, and faculty workload lives wherever HR or the provost's office happens to track it.
None of those systems were built to agree with each other automatically. Each one has its own definition of a term, its own academic calendar quirks, its own way of counting a student who withdrew mid-semester. Reconciling them isn't a report you build once. It's a maintenance job someone repeats every single time a number is needed.
AIR describes its mission as helping institutional research and effectiveness professionals "transform data into insight and insight into impact," per AIR's own site. That an entire international professional association exists to support exactly this work, at scale, across the sector, is a fair signal that the scattered-data problem is not a one-institution failure of effort. It's the default state, and closing it takes deliberate architecture, not just more diligent analysts.
What to Check Before Trusting a Dashboard
Plenty of tools marketed as "institutional analytics" or "academic decision support" are, underneath the visualization layer, still pulling from static exports on a schedule. The dashboard looks live. The data behind it might be three weeks old and manually refreshed.
| Approach | What it looks like in a meeting | Where it breaks down |
| Static PDF or slide report | A document emailed ahead of the meeting, already out of date by the time it's discussed | No follow-up question can be answered without a new data request and another multi-week wait |
| Dashboard on top of manual exports | A polished-looking interface with charts, refreshed weekly or monthly by someone re-running a script | Looks live, isn't; a follow-up question outside the pre-built charts still requires a manual pull |
| Governed analytics on one shared data layer | Leadership queries or drills into current data directly, across sources that already agree with each other | Requires more upfront work to define consistent metrics across offices, but pays that cost once |
If a vendor cannot explain how often the underlying data actually refreshes, and whether a follow-up question outside their pre-built charts requires a new export, the tool is a report generator wearing a dashboard's clothing. The honest test is simple: ask to see what happens when you ask a question the vendor's demo wasn't built to answer.
| Question to Ask a Vendor | Why It Matters |
| How current is the data behind this dashboard, and what refreshes it? | Separates genuine live decision support from a static export refreshed on a schedule |
| Can a leader drill into a metric that wasn't pre-built into a chart? | Tests whether the tool is truly queryable or just a fixed set of visualizations |
| Does this system share one definition of each metric across offices, or does each office keep its own? | A shared definition is what actually ends the reconciliation work, not the dashboard's appearance |
| What happens at accreditation or board review time, when a reviewer asks an unplanned question? | Reveals whether the system was built for routine reporting or for real interrogation under pressure |
Where Creatrix Campus Fits
Creatrix Campus connects enrollment, financial, course, and faculty data into one governed institutional data layer, with a single definition per metric shared across offices, rather than each department maintaining its own export and its own version of the truth.
Leaders query current data directly instead of waiting on a scheduled report. A provost asking about retention by program can drill into first-generation status, term, or department in the same session, because the underlying data is already reconciled, not because a new request was submitted and queued behind everyone else's.
The same governed layer that feeds a provost's dashboard also feeds board and accreditation reporting and department-level detail, so the numbers a president presents to a board already agree with what a dean sees when reviewing their own program.
Conclusion
The gap between a report and real decision support rarely shows up as a dramatic failure. It shows up quietly, as a promise to "get back to you" after a meeting, repeated often enough that nobody questions it anymore.
Closing that gap isn't about buying a tool with more charts. It's about whether enrollment, financial, course, and faculty data already agree with each other before anyone asks a question, so the answer is a query away instead of a project. Institutions that evaluate analytics software against that standard get genuine decision support. The rest get a nicer-looking report.
If you want to see how Creatrix Campus turns institutional data into an answer leaders can query directly, talk to us about institutional analytics and decision support.
Quick recap
Institutional analytics software should connect enrollment, financial, course, and faculty data into one governed layer with a single shared definition per metric, so leaders can query current data directly and drill into follow-up questions in the same sitting, instead of waiting weeks for IR to manually reconcile separate exports into a static report.
Frequently asked questions
What is institutional analytics software in higher education?
How is decision support different from a standard institutional report?
Why do universities still struggle to answer basic leadership questions quickly?
How can an institution tell if a reporting tool is genuinely live or just a dashboard on top of static exports?
How does Creatrix Campus support institutional decision making?
Join the conversation
Want to contribute?
We welcome thought leaders to share ideas and write for our blog.
Become a guest author