
On this page
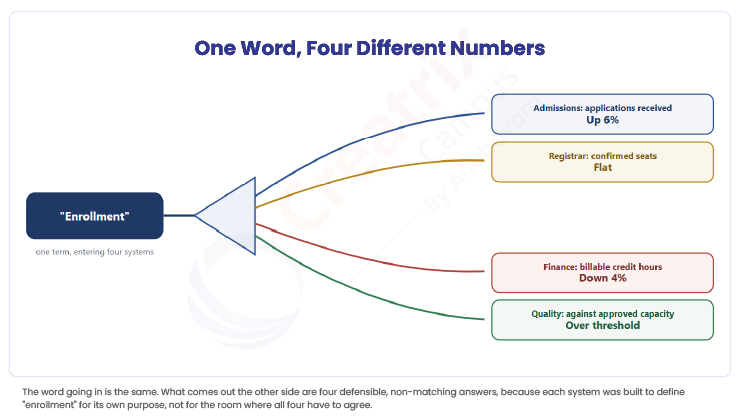
Ask five departments at the same university how enrollment is trending and you'll often get five different answers, not because anyone's wrong, but because "enrollment" means something slightly different in each system. Admissions counts applications. The registrar counts confirmed seats. Finance counts revenue-generating credit hours. Quality counts against approved capacity. Every number is defensible. None of them match.
That's higher education data integration in a sentence: not a shortage of data, a shortage of agreement about what the data is actually saying. Universities have more dashboards, more reports, and more analysts than they did five years ago, and leadership still walks into meetings holding three versions of "the truth" that were never reconciled with each other.
Quick answer
Higher education data integration isn't about collecting more data or building more dashboards, most institutions already have plenty of both. It's about getting enrollment, records, curriculum, outcomes, quality, and finance data to share one definition and one timeline, so a leadership conversation starts from agreement instead of reconciliation.
Article summary
Problem: Departments interpret the same institutional reality through separate systems, separate definitions, and separate timing, so leadership can't get a coordinated view even with abundant data.
For: Provosts, Institutional Effectiveness and Research leaders, CIOs, Registrars, and senior academic leadership
Shift: From adding more dashboards to connecting the definitions and timing behind the data that already exists.
Outcome: Leadership conversations that start from one shared picture, not five reconciled ones.
Key takeaways
- More dashboards don't fix disagreement between departments. Shared definitions do.
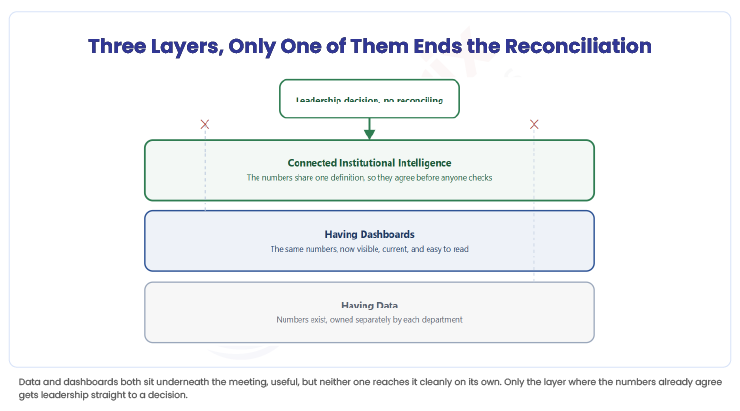
- Having data, having dashboards, and having connected institutional intelligence are three different states, not one.
- Most cross-departmental "data conflicts" are really definition conflicts wearing a data disguise.
- Coordinated decisions require a coordinated data model, not a faster export button.
Why This Matters
Picture a Provost heading into a budget meeting with three reports on the same programme: admissions says enrollment is up, finance says revenue is down, and quality says student-to-faculty ratios have quietly worsened, and all three are technically correct, because each was built on its own system's definition of the same term, which means the meeting starts with twenty minutes of reconciling numbers instead of deciding anything.
Data, Dashboards, and Intelligence Aren't the Same Thing
Here's where most institutions get stuck: they treat "more data" as the fix for a coordination problem, then wonder why the fix didn't take. Having data means the numbers exist somewhere, in some system, owned by some department. Having dashboards means someone made those numbers visible and pretty. Neither one touches the actual issue, which is whether the numbers agree with each other in the first place.
Connected institutional intelligence is a different thing entirely. It means enrollment, curriculum, outcomes, quality, and finance data share a common definition of the terms that matter, so when one number moves, the others that should move with it actually do, visibly, without someone manually checking five systems to confirm it. That's not a bigger dashboard. It's a different foundation underneath all of them.
| State | What it gives leadership | What it doesn't fix |
| Having data | Numbers exist somewhere, owned by individual departments | Whether those numbers agree with each other |
| Having dashboards | The numbers are visible, current, and easy to read | The definitions underneath them, which can still conflict |
| Having connected institutional intelligence | Enrollment, curriculum, outcomes, quality, and finance reading against a shared definition | Nothing new to build; it's the same data, finally speaking one language |
Why Does Every Department's Version of "Enrollment" Disagree?
This is the question worth asking before buying another analytics tool. Not "do we have enough data," but "do our systems agree on what our data means." Most don't, and it's rarely anyone's fault. Admissions was built to count applications. The registrar was built to count confirmed seats. Finance was built to count billable credit hours. Each system did exactly what it was designed to do. Nobody designed the moment where those three definitions would need to reconcile.
EDUCAUSE's own Top 10 IT Issues list for 2026 names building a data-centric culture as a defining institutional priority, and the emphasis there isn't collecting more of it. It's making the data that already exists usable across departments that were never designed to talk to each other. That's the piece institutional effectiveness work is actually meant to solve, and it's the same piece a connected academic platform has to solve underneath it, before any dashboard can be trusted to show the whole picture.
Conclusion
Your institution almost certainly doesn't have a data shortage. It has a definitions shortage, five departments, five defensible answers, and no shared vocabulary connecting them. More dashboards won't close that gap, because a dashboard just makes a disagreement easier to see, not easier to resolve. Closing it means getting enrollment, curriculum, outcomes, quality, and finance to agree on what their numbers mean before anyone builds the next report.
If your last three leadership meetings started with reconciling conflicting numbers instead of deciding what to do about them, that's the tell.
See how connected institutional data actually changes a leadership conversation.
Quick recap
Higher education data integration isn't a volume problem, it's an agreement problem. Admissions, the registrar, finance, and quality each define terms like "enrollment" correctly for their own purpose, and those definitions rarely match. More dashboards make the disagreement more visible, not less real. What actually changes the leadership conversation is enrollment, curriculum, outcomes, quality, and finance sharing a common definition, so the numbers agree before anyone has to reconcile them by hand.
Frequently asked questions
What does "higher education data integration" actually mean?
Isn't this the same as building better dashboards?
Why do departments end up with conflicting numbers for the same metric?
Does data integration replace the analytics tools we already use?
Who should be asking whether their institution's data is actually integrated?
Join the conversation
Want to contribute?
We welcome thought leaders to share ideas and write for our blog.
Become a guest author