
On this page
Most institutions preparing for accreditation already own a reporting tool capable of producing clean charts and summaries. The harder problem sits earlier: before any report can be built, someone has to pull attainment data, compliance records, and quality metrics out of separate systems and reconcile them into something a report can actually use.
Quick answer
Data reporting tools for academic accreditation help institutions present evidence clearly, but they cannot fix a deeper problem: accreditation data usually lives scattered across student, faculty, and financial systems and has to be manually consolidated before any report is accurate. Real-time analytics and compliance tracking work well only when the underlying data is already connected, not reconciled for each audit cycle.
Article summary
Institutions often assume accreditation reporting is a visualization problem, so they invest in tools that produce cleaner charts and summaries. The real difficulty is upstream of that: attainment reports, compliance tracking, and quality metrics depend on data pulled from systems that were never built to talk to each other, and someone has to consolidate that data manually before any tool can chart it. This article explains why data consolidation, not visualization, determines how painful audit preparation actually is.
Key takeaways
Institutions often assume accreditation reporting is a visualization problem, so they invest in tools that produce cleaner charts and summaries. The real difficulty is upstream of that: attainment reports, compliance tracking, and quality metrics depend on data pulled from systems that were never built to talk to each other, and someone has to consolidate that data manually before any tool can chart it. This article explains why data consolidation, not visualization, determines how painful audit preparation actually is.
What Accreditation Reporting Actually Requires
Accreditation reporting sounds like a visualization task: take data, turn it into charts and summaries, hand it to reviewers. In practice, most of the effort happens before any chart exists. Attainment reports need outcome data pulled from assessment records. Compliance tracking needs policy and process evidence pulled from multiple departments. Quality metrics need consistent definitions applied across programmes that may all be measuring things slightly differently.
| Reporting Need | Where the Underlying Data Usually Lives | Why It's Hard to Compile |
| Attainment reports | Assessment and outcomes records, often per course or programme | Different rubrics and formats across departments |
| Compliance tracking | Policy documents, governance minutes, departmental files | Evidence scattered across offices with no shared structure |
| Quality metrics | Student, faculty, and financial systems | Metrics defined inconsistently between systems |
| Audit preparation | All of the above, reconciled into one narrative | Reconciliation typically starts from scratch each cycle |
A reporting tool can present any of this well once it is in one place. Getting it into one place is the actual work.
The Real Bottleneck Is Consolidation, Not Visualization
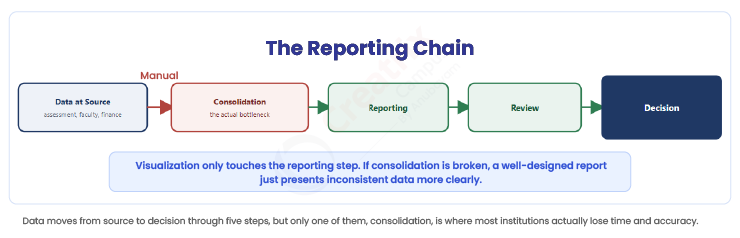
The operating chain behind any accreditation report looks like this: data gets created at the source, in an assessment record, a faculty file, a compliance log, then it needs to be consolidated into a consistent structure, then reported, then reviewed, then acted on. Visualization only touches one step in that chain. If the consolidation step is broken, a well-designed report just presents inconsistent data more clearly.
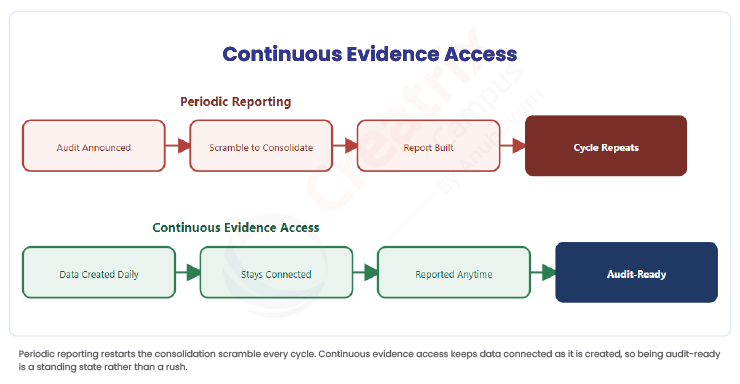
This is why accreditation reporting so often becomes a pre-audit scramble. Data consolidation gets treated as a one-time project that happens whenever an audit is coming up, rather than something that happens continuously as academic and administrative work occurs. Every cycle starts the reconciliation over again, because nothing kept the underlying data connected in between.
Real-time analytics and compliance tracking only live up to their names when the data behind them is actually current. A report labeled real-time is not real-time if the data feeding it was last consolidated three months ago.
From Periodic Reporting to Continuous Evidence Access
Periodic reporting treats data consolidation as a project. Continuous evidence access treats it as an operating discipline that runs alongside daily academic work, so a report only needs to draw on records that are already current.
| Periodic Reporting | Continuous Evidence Access |
| Data consolidated before each audit or review | Data stays connected as it is created |
| Attainment reports rebuilt from source records each cycle | Attainment data remains traceable to its source continuously |
| Compliance evidence gathered department by department | Compliance evidence stays organised within a shared structure |
| Quality metrics reconciled manually before reporting | Quality metrics stay consistent because definitions don't shift between systems |
This is an institutional operating comparison, not a claim about any single reporting product. The report itself should be the easy part. The evidence behind it should not need to be rebuilt every time someone asks for it.
Where Creatrix Campus Fits
Creatrix Campus keeps attainment data, faculty records, and accreditation evidence connected to the academic and administrative work that produces them, rather than reconciled separately before each audit. That gives quality and accreditation teams evidence that stays current between cycles, so compliance tracking and quality metrics reflect what the institution is actually doing rather than a snapshot pulled together under deadline. It does not replace institutional judgement about what evidence means, and it does not guarantee any accreditation outcome. It reduces how much manual reconciliation stands between daily academic work and an accurate report.
Conclusion
The reporting tool was never really the bottleneck. The bottleneck is how much manual work happens before any tool has accurate data to work with. See how Creatrix Campus can help you keep accreditation evidence connected between audit cycles.
Quick recap
Data reporting tools make accreditation evidence easier to present, but they cannot fix data that is scattered across disconnected systems. The real cost sits in consolidation, not visualization; attainment reports, compliance tracking, and quality metrics are only as reliable as the reconciliation behind them. Institutions that keep evidence connected continuously spend far less time rebuilding it before every audit.
Frequently asked questions
What are data reporting tools for academic accreditation?
Why don't reporting tools solve accreditation reporting problems on their own?
What is data consolidation in the context of accreditation?
How does real-time analytics help with audit preparation?
How should institutions prepare attainment reports more efficiently?
Join the conversation
Want to contribute?
We welcome thought leaders to share ideas and write for our blog.
Become a guest author